All Projects
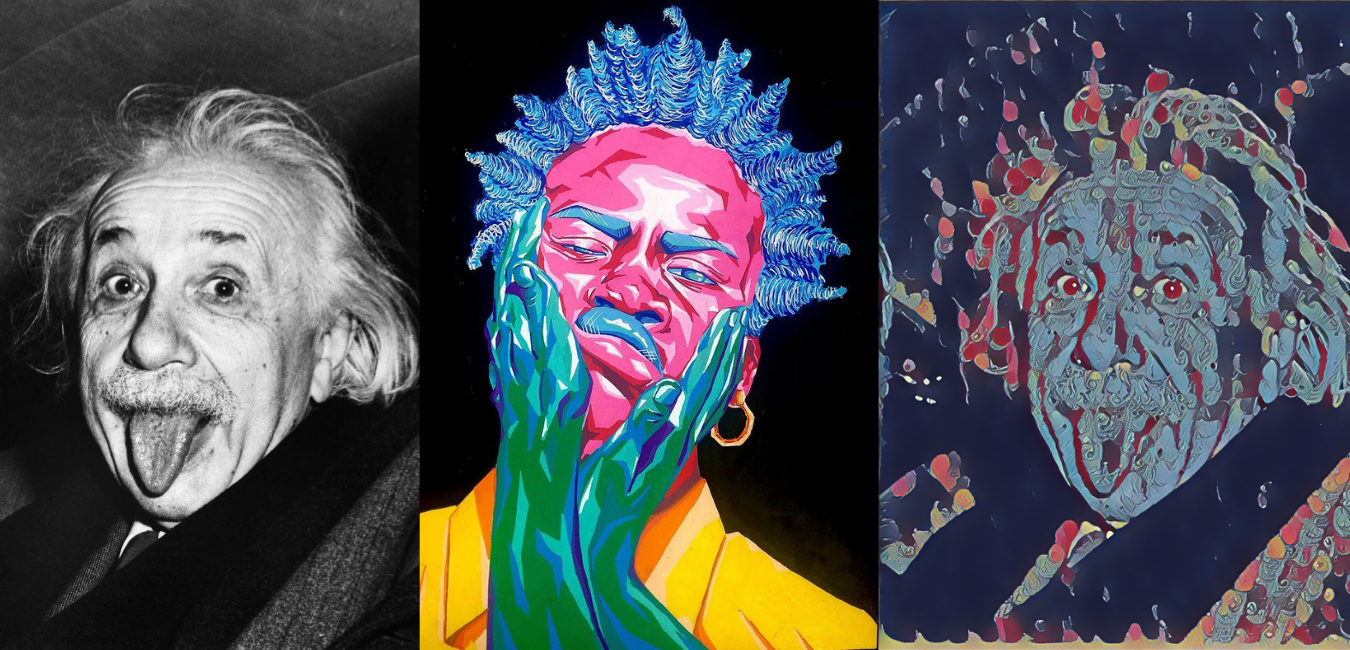
Fast Neural Style Transfer
October 2021 | Python

Access the app here. Code can be viewed on GitHub
Building an Entity Normalization Engine
August 2021 | Python

The approach consisted of the following steps:
- Retrieve incoming string, feed to Facebook’s bart-large-mnli NLI-based Zero Shot Text Classification model using HuggingFace’s zero-shot classification pipeline. Assign class with highest probability to string.
- Feed string to that class-specific entity normalization engine. Each class-specific engine has its unique text pre-processing pipeline and uses TF-IDF with N-Grams to calculate cosine similarities for all strings in that class.
- Entities are then grouped based on a minimum threshold of cosine similarity and we output a CSV with grouped entities and their group-representatives.
ElonBot: The Discord AI Bot for Chatting and Moderation
June 2021 | Python

The data used are webscraped transcripts from Elon’s interviews on Clubhouse and the Lex Fridman podcast, as well as a ready-to-use dataset retrieved from Kaggle of Elon’s interview on the Joe Rogan Experience.
Code can be viewed on GitHub
Tabular Playground Series - Mar 2021 (Kaggle)
March 2021 | Python

The dataset used for this competition is synthetic but based on a real dataset and generated using a CTGAN. The original dataset deals with predicting the amount of an insurance claim. Although the features are anonymized, they have properties relating to real-world features. My best submission scored a AUC-ROC of 0.88675 on the private leaderboard, placing me in the top 700.
Code can be viewed on GitHub
Rainforest Connection Species Audio Detection
February 2021 | Python

The goal of this project was to build a machine learning model to automate the detection of bird and frog species in tropical soundscape recordings, as part of a Kaggle competition. The models had to be created with limited, acoustically complex training data. My best submission scored a label-weighted label-ranking average precision of 0.71 on the private leaderboard.
Code can be viewed on GitHub
Real or Not? NLP with Disaster Tweets
August 2020 | Python

Acknowledgments: this dataset was created by the company figure-eight and originally shared on their ‘Data For Everyone’ website here.
Code can be viewed on GitHub
Classifying Endangered Birds From the Prek Toal Reserve
July 2020 | Python

Code can be viewed on GitHub
Identifying Improper Mask Wear
July 2020 | Python

Code can be viewed on GitHub
Montreal Temperature Spiral (1872-2019)
December 2019 | Python
Background: Ed Hawkins, a climate scientist, unveiled an animated visualization in 2017 which captivated the world. This visualization showed the deviations of the global average temperature from 1850 to 2017. It was reshared millions of times over Twitter and Facebook and a version of it was even shown at the opening ceremony for the Rio Olympics.
This animation was created with the help of an article on Dataquest.io written by Srini Kadamati.
Historical weather data was retrieved from Environment Canada’s website. Recordings from the Montreal McGill Station (Dr. Penfield Street/Redpath Street) provided monthly weather data from 1872 to 1993 while recordings from the Montreal McTavish Station (McTavish Street/Dr. Penfield Street), just 700 meters away, provided daily weather data from 1994 to 2019. Combining data from both sources may constitute a source of error, but with the unavailability of continuous weather recordings from 1872 to 2019 from a single station, there appears to be no alternative solution.
Code can be viewed on GitHub
Analyzing a Star Wars Survey
July 2019 | Python

The team needed to collect data addressing this question. To do this, they surveyed Star Wars fans using SurveyMonkey. They received 835 total responses, which are downloadable from their GitHub repo.
The goal of this project was to conduct a rapid cleaning, exploration and analysis of the data.
Code can be viewed on GitHub
Analyzing NYC High School Data
June 2019 | Python

- SAT scores by school - SAT scores for each high school in New York City
- School attendance - Attendance information for each school in New York City
- Class size - Information on class size for each school
- AP test results - Advanced Placement (AP) exam results for each high school (passing an optional AP exam in a particular subject can earn a student college credit in that subject)
- Graduation outcomes - The percentage of students who graduated, and other outcome information
- Demographics - Demographic information for each school
- School survey - Surveys of parents, teachers, and students at each school
Code can be viewed on GitHub
Analyzing Employee Exit Surveys
June 2019 | Python

I played the role of a data analyst and pretended my stakeholders want to know the following:
- Are employees who only worked for the institutes for a short period of time resigning due to some kind of dissatisfaction? What about employees who have been there longer?
- Did more employees in the DETE or TAFE institute end their employment because they were dissatisfied in some way?
- How many people in each age group resigned due to some kind of dissatisfaction? Are younger employees resigning due to some kind of dissatisfaction? What about older employees?
Code can be viewed on GitHub
Job Outcomes of College Students Between 2010 and 2012 in the U.S.
May 2019 | Python

This project was done to showcase how using the pandas plotting functionality along with the Jupyter notebook interface allows us to explore data quickly using visualizations.
Using visualizations, I explored the following questions from the dataset:
- Do students in more popular majors make more money?
- How many majors are predominantly male? Predominantly female?
- Which categories of majors have the most students?
Exploring Hacker News Posts
April 2019 | Python

Hacker News is a site started by the startup incubator Y Combinator, where user-submitted stories (known as ‘posts’) are voted and commented upon, similar to Reddit.
I was specifically interested in posts whose titles begin with either ‘Ask HN’ or ‘Show HN’. Users submit ‘Ask HN’ posts to ask the Hacker News community a specific question. Likewise, users submit ‘Show HN’ posts to show the Hacker News community a project, product, or just generally something interesting.
I compared these two types of posts to determine the following:
- Do Ask HN or Show HN posts receive more comments on average?
- Do posts created at a certain time receive more comments on average?
- Do Ask HN or Show HN posts receive more points on average?
- Do posts created at a certain time receive more points on average?
eBay Car Sales Analysis
March 2019 | Python

The dataset was originally scraped and uploaded to Kaggle. A few modifications were made by Dataquest to the original dataset that was uploaded to Kaggle:
- The dataset was trimmed down to 50,000 data points from the full dataset
- The dataset was dirtied a bit to more closely resemble what could be expected from a scraped dataset (the version uploaded to Kaggle was cleaned to be easier to work with)
Code can be viewed on GitHub
Profitable App Profiles for the App Store and Google Play Markets
February 2019 | Python

Goal: My goal was to help the company’s developers understand what kinds of apps are likely to attract more users on Google Play and the App Store.
Code can be viewed on GitHub
